Course Project
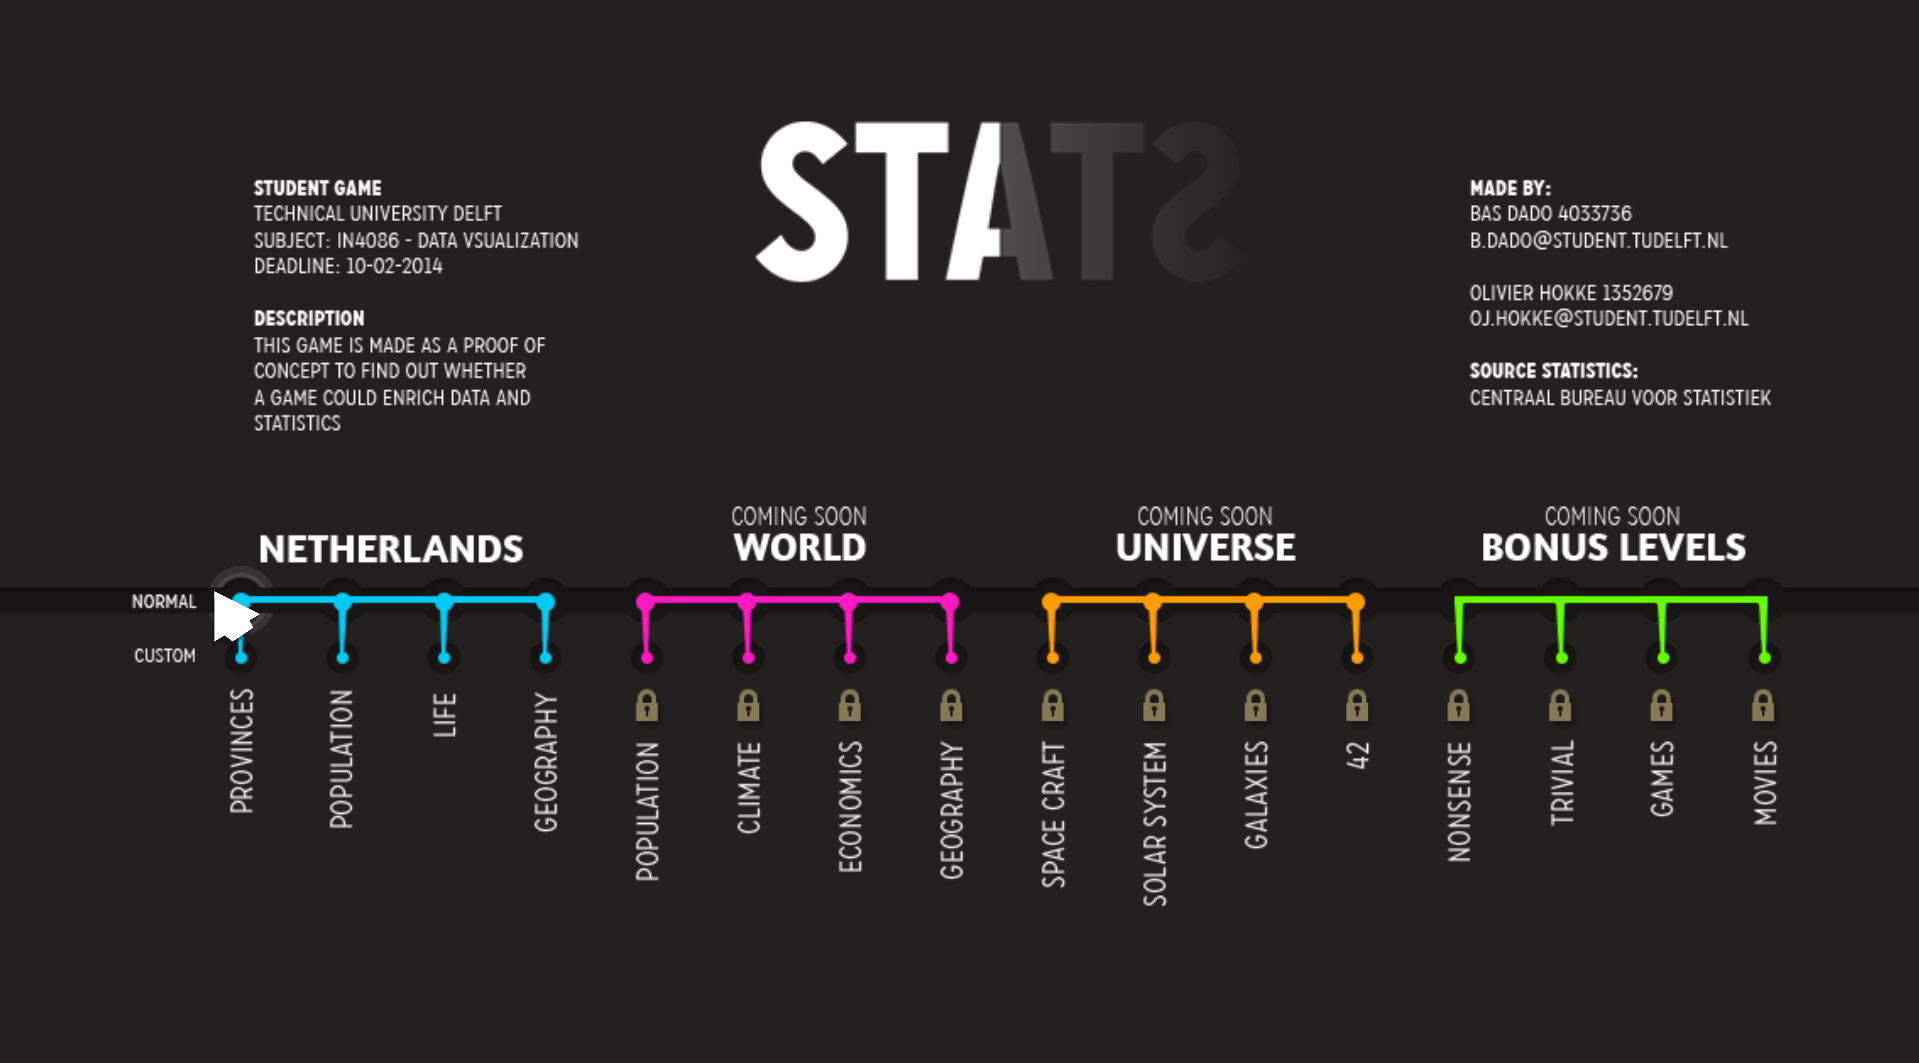
STATS
- C#
- Unity
For a course during my study, we were required to make an application for data visualization. Most people made some nice selection or filter tools, or a visualization for a higher-dimensional dataset, but a friend of mine and I decided that we could just make a game. The main focus was on making the game look good, while still retaining the possibility to show understandable statistics about a certain subject.
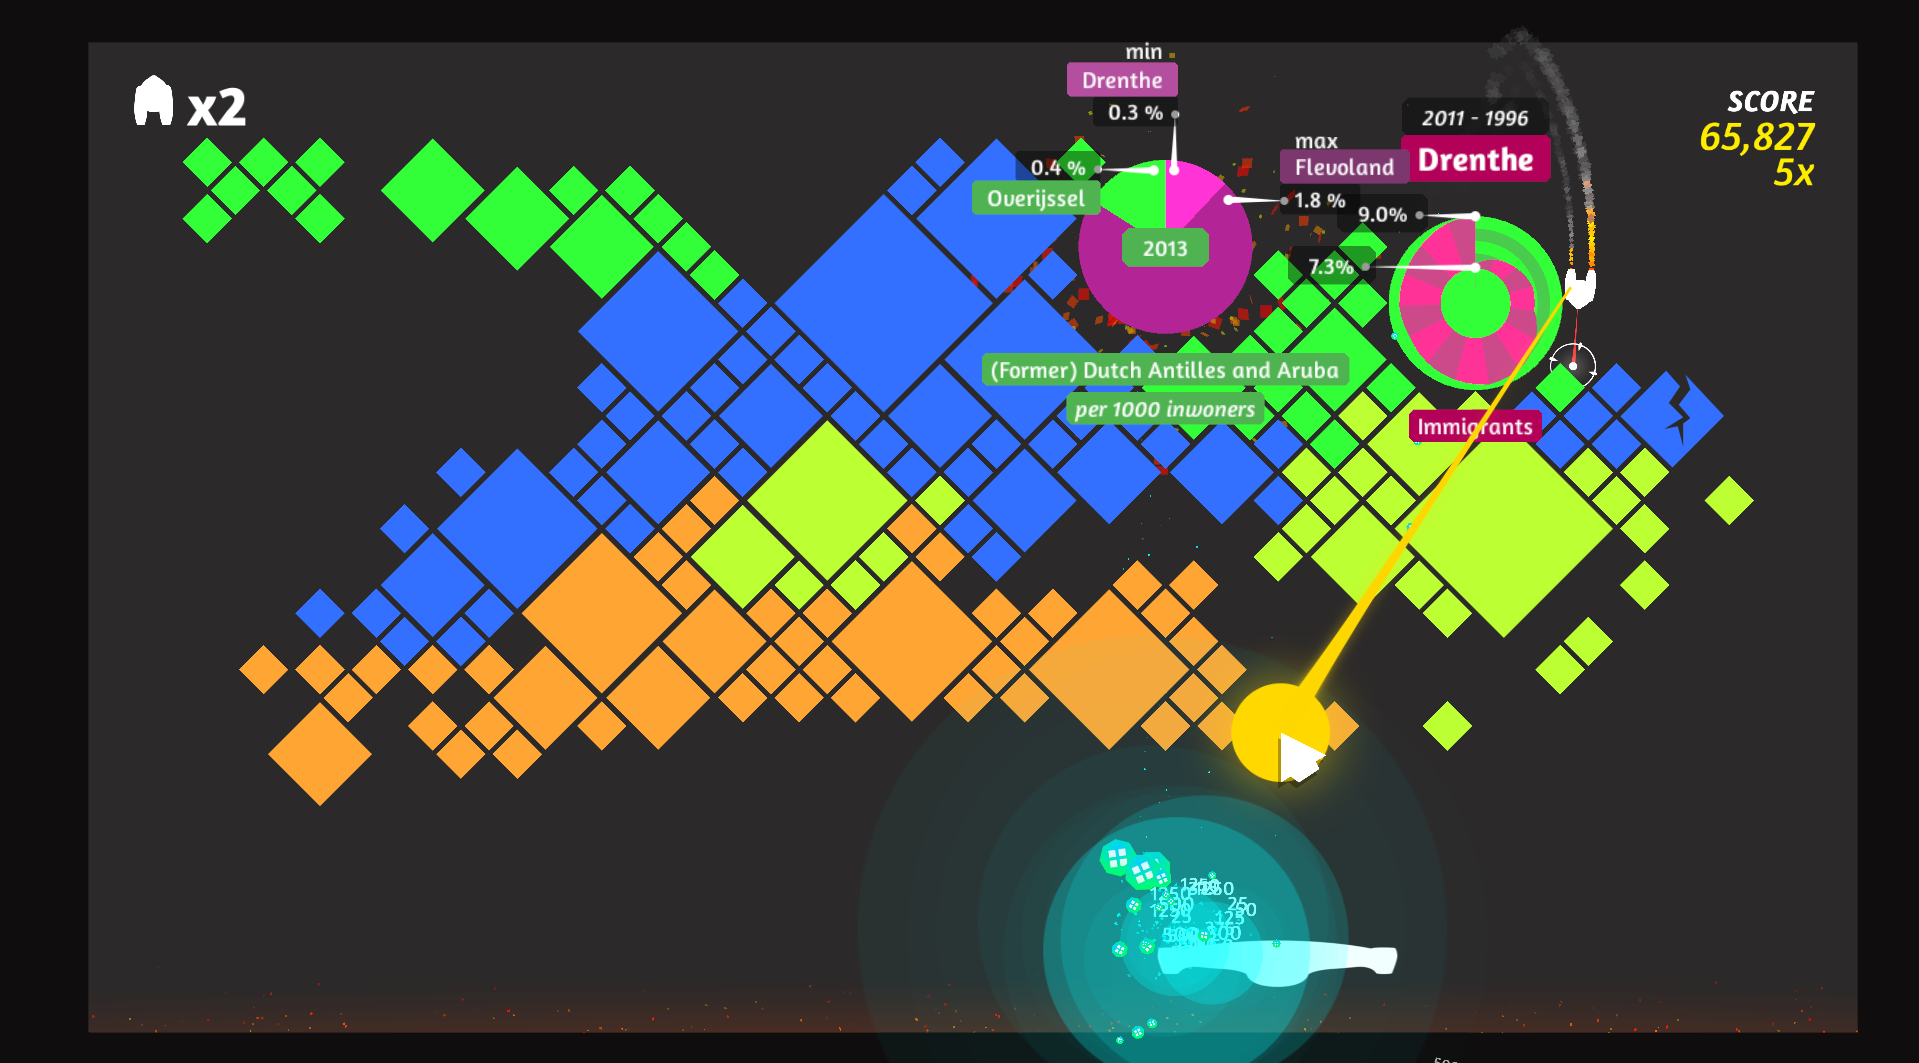
To do this, we decided to make a breakout clone with some twists. First of all, all the blocks are rotated 45 degrees, which leads to objects bouncing if in a less predictable, but still fully deterministic, manner, making the game more challenging. We also made sure that some blocks actually contain statistics (such as number of inhabitants per year, or per city). Everytime a fact-block is hit, more information is revealed. Statistics can be either a pie chart or a graph. Because only little information is added on every hit, the player can easily process it.
Cool technical features of the game are: a randomly generated map based on an image of the netherlands, facts are build from a dataset with multiple dimensions (location, time, value, etc.) and many visual effects for juicyness.
WINDOWS